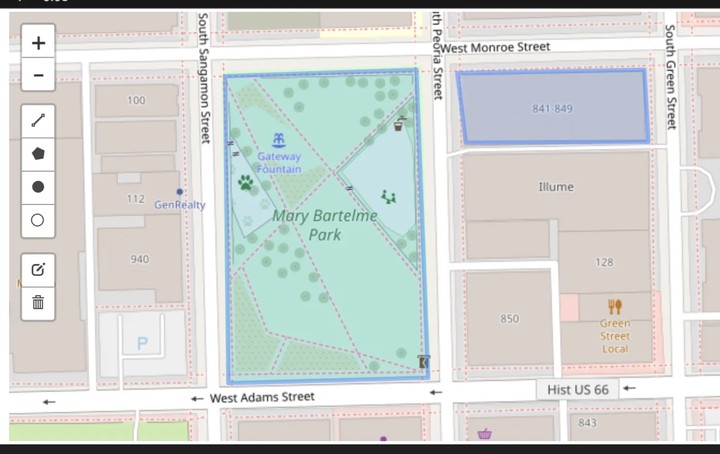
Create an interactive mapping tool within a Jupyter Notebook

Abstract
The article provides a step-by-step guide to developing a dynamic mapping application using Python. It covers the installation of necessary libraries, including Folium and GeoPandas, and demonstrates how to visualize geospatial data interactively. The tutorial includes practical examples, such as plotting geographical points and regions, and offers tips for customizing maps with various features. This resource is valuable for data scientists and analysts interested in integrating interactive maps into their Jupyter Notebooks.
Type
Publication
Medium