Energy End-Use Classification
 Overview of Project Solution
The end-use classification model was written in the Python language and makes use of common packages used for data wrangling, analysis, and modeling such as Pandas and Sci-Kit Learn.
Introduction
This project was completed by myself and three other of my classmates in the UBC Master of Data Science Program (MDS) and was completed in partnership with UBC Urban Data Lab as a requirement of the program. The focus of the 9-week project was to build a semi-supervised classification model capable of assigning a secondary energy end-use category to all energy usage sensors (i.e. electrical meters/submeters) in the Pharmaceutical Sciences Building on UBC’s Vancouver campus. The results could then be used to sum up the energy usage by end-use category for a given time period and display the results in a web-based visualization dashboard.
About the Data
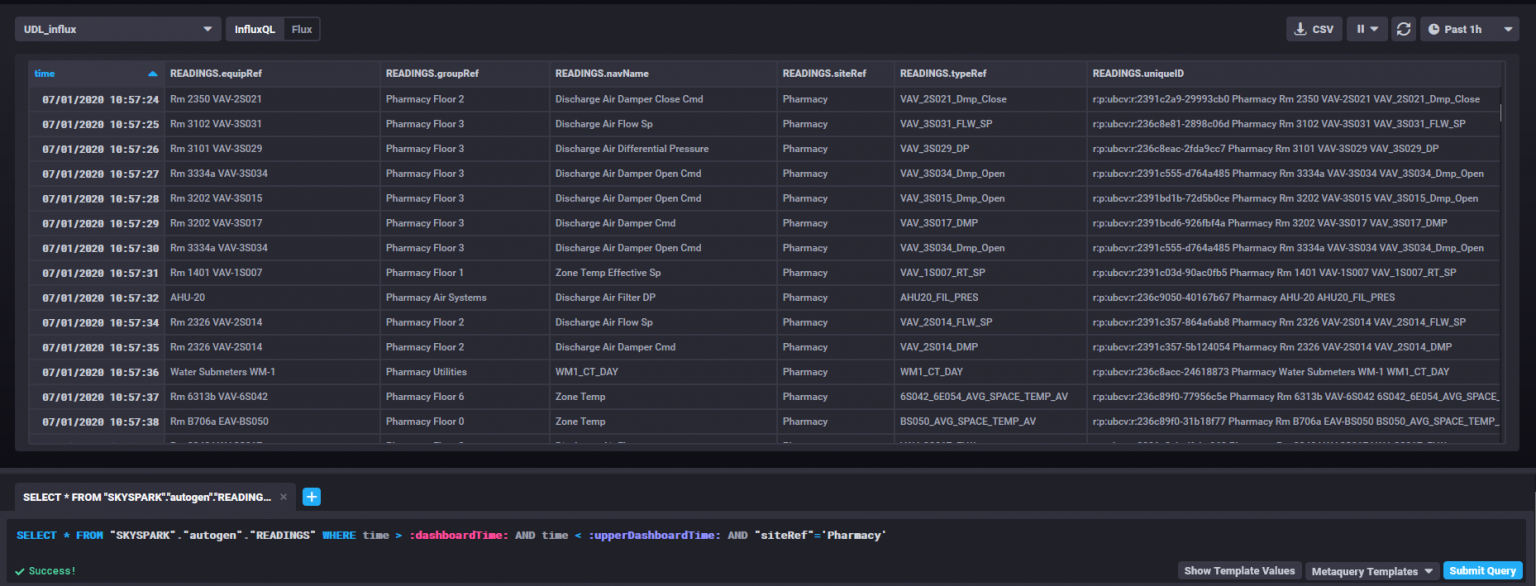
The data used for this project came from UDL’s InfluxDB SKYSPARK instance and was queried using the InfluxDB-Python package and the InfluxQL language. The project scope was limited to the Pharmaceutical Sciences Building (Pharmacy Building) because this modern building has a significant number of sensors that are well documented with descriptive tags. The only sensors requiring end-uses were those that measure energy consumption (such as an electrical meter at the inlet of the building or sub-meter for energy fed to a specific system, floor, or piece of equipment). These sensors of interest are referred to in this project as Energy Consumption (EC) sensors. All other sensors in the building (such as temperature sensors, room occupancy sensors, fan speed sensors, ventilation system sash opening sensors, etc.) are referred to as Non-Energy Consumption (NC) sensors but were used as inputs to the model to help with the goal of predicting the end-uses of the EC sensors. There were just over 200 EC sensors and 7,800 NC sensors present in the Pharmacy Building’s data.
About the Model
The end-use classification model was written in the Python language and makes use of common packages used for data wrangling, analysis, and modeling such as Pandas and Sci-Kit Learn. The general concept is shown in the flowchart below.
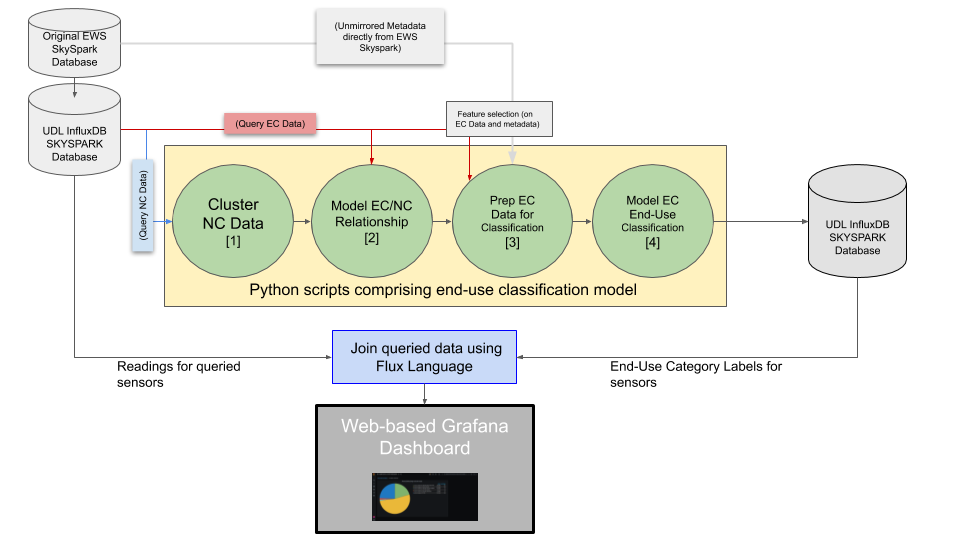
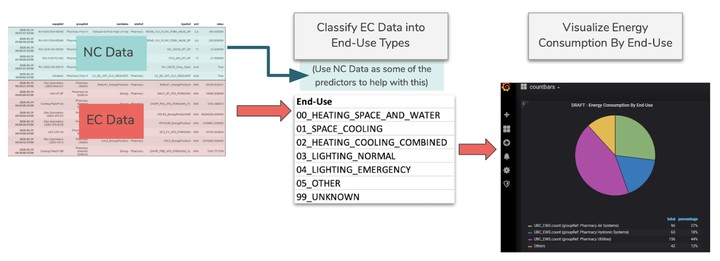
The basic idea is to first condense the ~7800 NC sensors in the Pharmacy building down to a more manageable size using clustering. Next, model and extract information on how these clusters of NC sensors react relative to each EC sensor. Finally, pass the numbers representing that relationship between NC and EC sensors into a supervised classification model along with some other information about the EC sensors and a “training” set of EC sensors that have already been manually labelled with end-use types. Once this model has been trained on this set of EC sensors, it can be used to predict end-uses for data without known end-uses and the results can be stored back into UDL’s InfluxDB instance. Please see the project’s GitHub repository for a full report and more details on the model.
Results and Visualization Dashboard
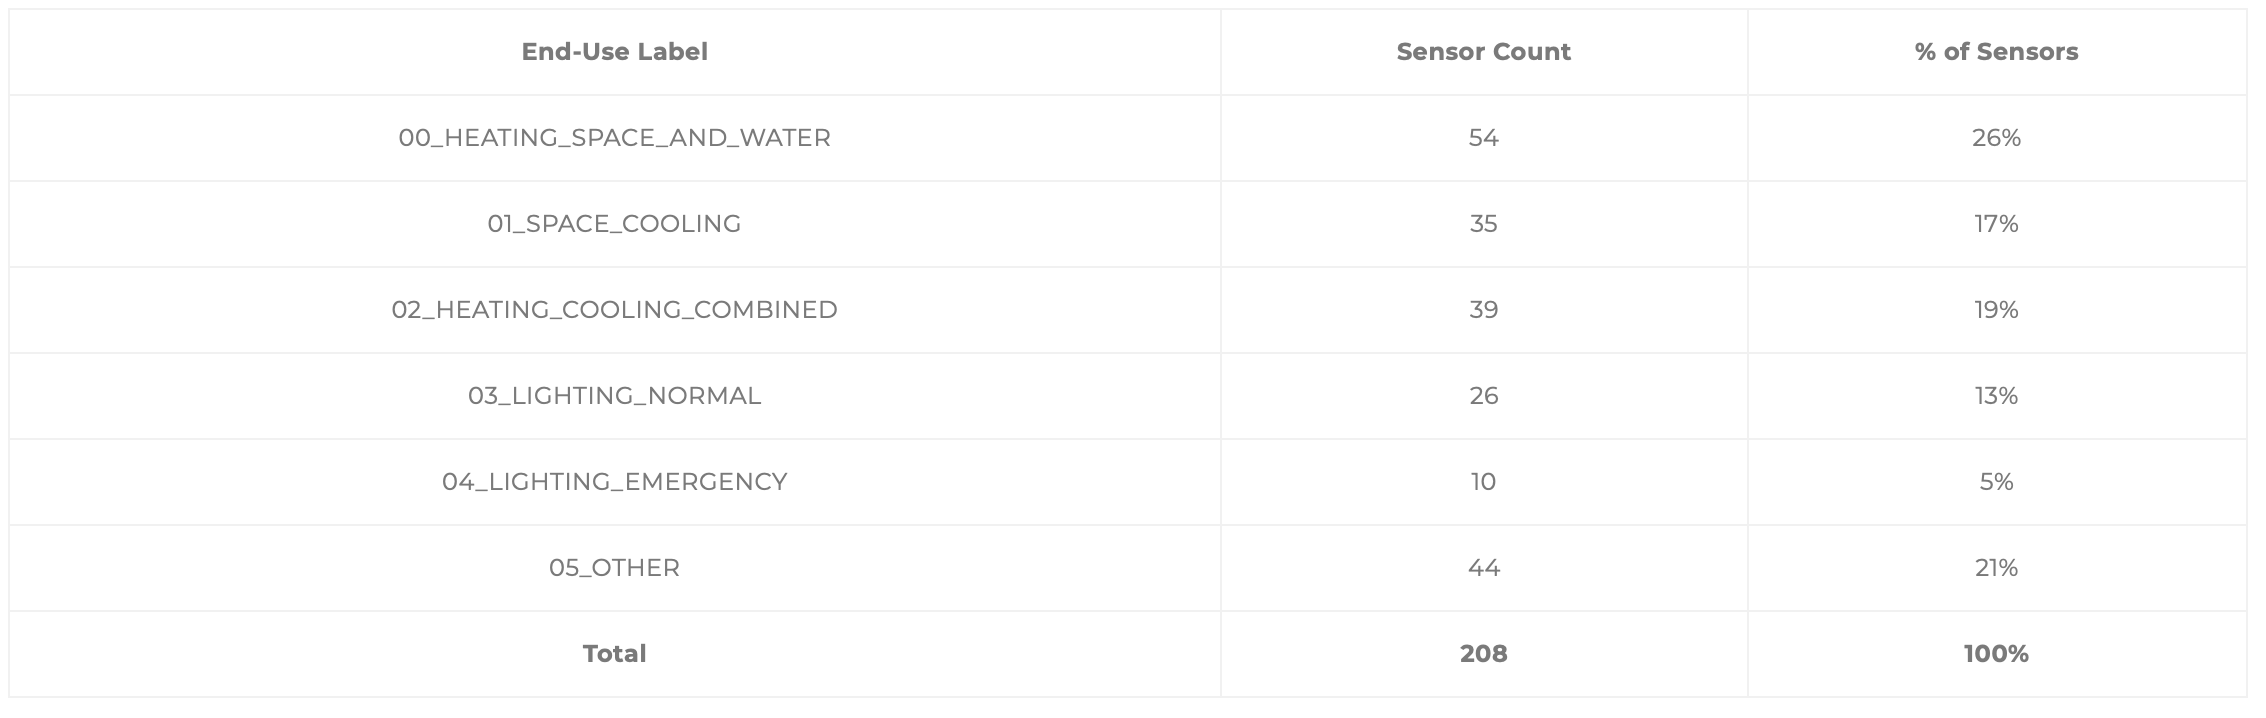
The resulting end-use labels for all EC sensors in the Pharmacy Building were:
Each EC Sensor’s ID and end-use category label was stored back in the UDL InfluxDB at the end of the modelling process. This allows the label to be accessed along with the energy usage readings for that sensor. Using Grafana open source visualization software and the Flux language, the team created a pie-chart as a proof of concept result for the overall process of querying data from the database, classifying end-use energy types for each EC sensor, storing the results, and finally accessing and visualizing the stored results.
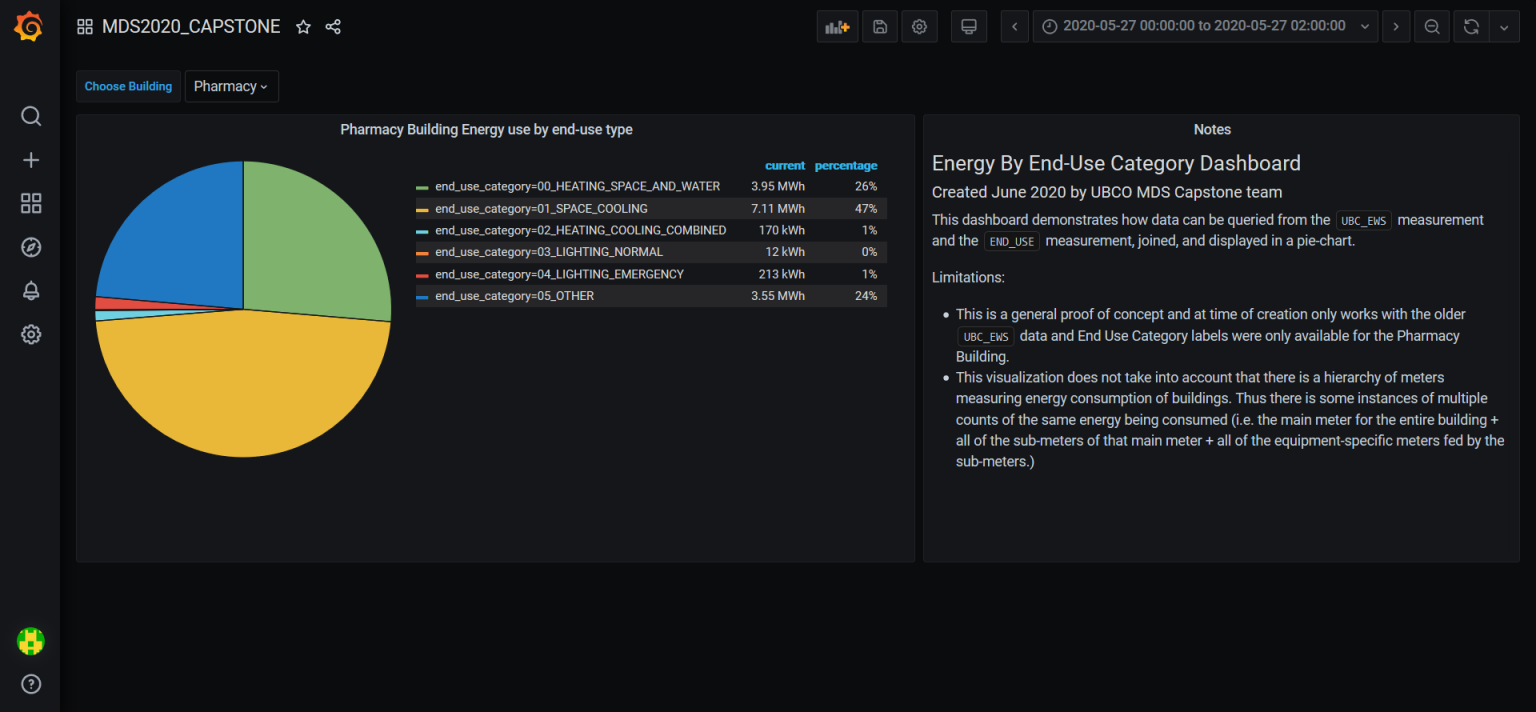
At this time, this proof of concept dashboard is not publicly accessible but as seen in the screen shot above, the pie-chart is a summation of the energy used within the Pharmacy Building, grouped by end-use category for the given date-range.
Link to project repository: https://github.com/UBC-UrbanDataLab/Classifying-End-Use-MDS2020
Link to project on companies website: https://urbandatalab.io/project/mds-captone-2020/
Co-collaborator: Eva Nguyen, Connor Lee, Alex Tamm
Claudia Nikel
Clinical Data Analyst
My educational interests include Machine Learning, Data Visualizations, coding and anything Data Science related.